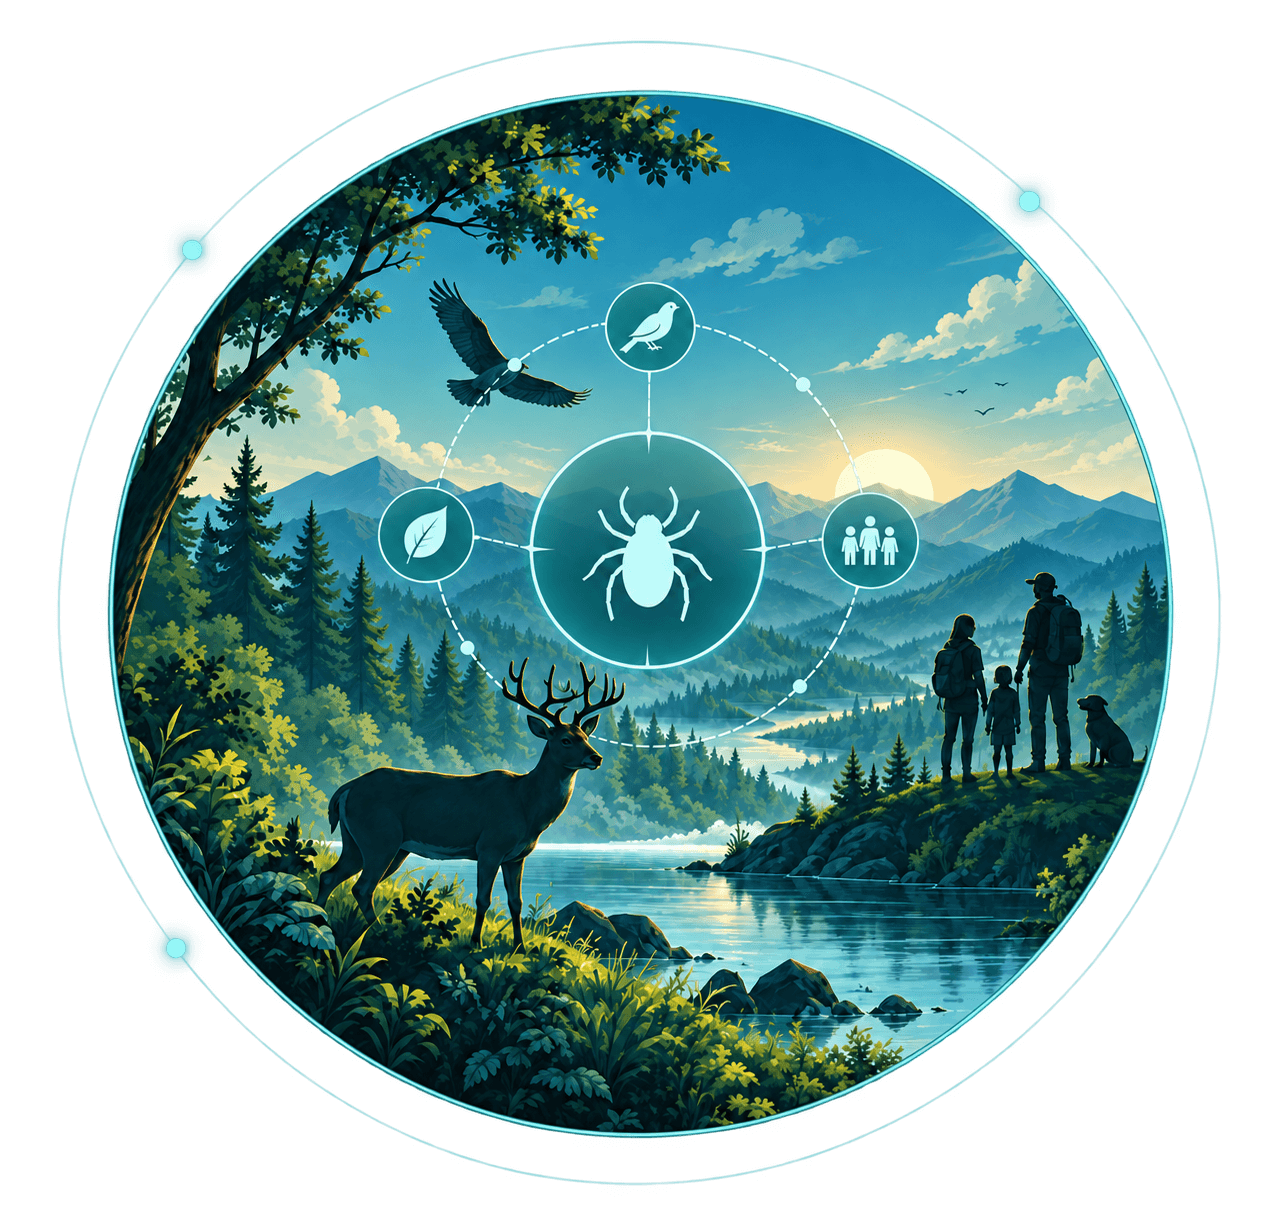
One Health Atlas brings county-level Lyme surveillance, tick and pathogen data, and community context into one place. It helps public health professionals compare counties, review data gaps, and identify questions for local follow-up.
Designed for epidemiologists and vector-borne disease programs.
What can we learn by looking at the data together?
Start with reported Lyme disease, then add tick surveillance and community context. This illustrative walkthrough uses published data from Montgomery County, Virginia, to explore what the sources tell us and what questions remain.
01 / The first signal
Start with reported Lyme disease.
Reported Lyme disease cases reflect illness diagnosed among county residents and captured by public health surveillance. These records help describe the reported burden of disease.
Surveillance records do not capture every infection. Cases are reported by county of residence, which may differ from where exposure occurred.
Sources and interpretation
This is a cited snapshot of the published release. CDC's 2023 county-linked Lyme surveillance rows for Montgomery County are four probable rows, with frequencies 8, 29, 5, and 29.
Atlas records their sum, 71 probable cases, as a published privacy-protected minimum, not a complete county total, because suppressed rows are omitted.
Publication suppression and infections missed by surveillance are different limitations. The minimum does not estimate infections that surveillance did not capture.
Records are assigned by county of residence. Residence can differ from where exposure occurred.
Virginia has 293 state-unallocated 2023 records. Those records cannot be assigned to Montgomery County, and they are not added to the county count.
The release's calculated minimum rate is 71.45 per 100,000, using the population value of 99,373. This is an Atlas-calculated minimum reported-case rate, not a complete incidence estimate.
Do not compare this single-year finding with years before the 2022 surveillance definition change.
Human disease surveillanceReported cases provide a starting point for review.At least 71 reported probable casesLyme disease · 2023
02 / The vector view
Add tick and pathogen data.
Tick surveillance helps establish which tick species have been found in a county. Testing collected ticks can also identify pathogens they carry. Together, these findings add another perspective to the human case record.
Where, when, and how ticks were sampled shapes what the results can tell us. Missing records do not establish absence.
Sources and interpretation
CDC ArboNET county tick status and tickborne pathogen status for this county are cumulative through December 31, 2025.
Ixodes scapularis is classified Established: the published CDC county classification for this species. Borrelia burgdorferi is classified Present: the published classification that the pathogen was detected. Ixodes pacificus is No records.
No records remains distinct from not detected. It means the published table has no county record for that species.
These are cumulative classifications with no sampling denominator. They do not establish current tick abundance, infection prevalence, or countywide sampling coverage. They do not establish where individual human cases were exposed.
Tick and pathogen surveillanceTick observations and testing add another perspective.Ixodes scapularis: EstablishedBorrelia burgdorferi: PresentCumulative records through December 2025
03 / The shared context
Place the data in context.
Surveillance findings are part of a larger community picture. One Health Atlas brings insurance coverage, social vulnerability, and rural-urban classification alongside human and tick surveillance. Viewing these data together helps public health professionals ask more informed questions about local needs and potential barriers to care.
Insurance coverage describes one aspect of healthcare access. These county-level measures do not establish underdiagnosis or underreporting, or determine an individual’s risk.
Sources and interpretation
The uninsured percentage is 5.3%. The denominator is the civilian noninstitutionalized population. The source field is EP_UNINSUR in the CDC/ATSDR SVI 2022 product, which uses the 2018–2022 American Community Survey.
The overall national SVI percentile rank is 0.2873. The uninsured national percentile rank is 0.1893. A percentile rank compares this county with other counties. It is not a percentage of people.
The 2023 Rural-Urban Continuum Code is 3. USDA describes code 3 as a county in a metro area of fewer than 250,000 people. That population threshold describes the metro area, not the county population.
These contextual measures do not establish actual healthcare utilization, Lyme underdiagnosis, underreporting, or individual disease risk.
Community contextCommunity conditions help frame local public health questions.5.3% uninsuredCDC/ATSDR SVI · 2018–2022 ACS
ATLAS / ILLUSTRATIVE WALKTHROUGHGeographic focus
Montgomery CountyVirginia · United States
Human disease surveillanceReported cases provide a starting point for review.At least 71 reported probable casesLyme disease · 2023
Tick and pathogen surveillanceTick observations and testing add another perspective.Ixodes scapularis: EstablishedBorrelia burgdorferi: PresentCumulative records through December 2025
Community contextCommunity conditions help frame local public health questions.5.3% uninsuredCDC/ATSDR SVI · 2018–2022 ACS
Markers illustrate data perspectives, not case or sampling locations.Interpret data in light of their source, location, and time period.
From data to local questions
Bring separate data into a shared view.
One Health Atlas connects human Lyme disease surveillance, tick and pathogen records, and community context by county. Public health professionals can review these findings together, trace them to their sources, and identify where local information could strengthen interpretation.
For Montgomery County, the result is a starting point for discussion: reported illness among residents, documented tick and pathogen presence, and insurance coverage, each with its own period and limitations.
A question for local review
What do local exposure histories and tick sampling records add to our understanding of the reported cases?
The combined view supports further review. It does not, by itself, establish underreporting or a surveillance gap.
Atlas review priority
Montgomery County has a Watch priority in this release. This relative priority is calculated using versioned scoring rules to help organize county review. It does not mean low Lyme disease risk or low disease burden.
In the workspace
County review in One Health Atlas
One Health Atlas helps public health programs organize data review, consider community context, and focus questions about surveillance, prevention, outreach, and professional education.
1
Select a county
Start with the national map or focus on a state, then select a county of interest.
2
Review the data
Examine human, tick, pathogen, and community data alongside their sources, time periods, and limitations. Review the county’s priority for follow-up and the rationale behind it.
3
Identify follow-up actions
Use suggested follow-up as a starting point for interpreting findings and considering next steps with local context.
4
Compare and share findings
Compare two counties side by side, or download an available county PDF to support public health review and planning.
Sign-in provides access to the map, county data, and review tools.
Confidence through clarity
What's missing from the data matters, too.
Every finding has a source, a time period, and limits to its interpretation. One Health Atlas makes these details visible so public health professionals can assess what the data support and where additional information is needed.
Reported probable cases
2023 · County of residence
Tick and pathogen status
Cumulative through December 2025
Insurance coverage
2018–2022 ACS · CDC/ATSDR SVI 2022
Review priorities
County review priorities use defined, versioned scoring rules. The methodology explains how the published data contribute to the results.
Ask Atlas
Ask Atlas is a separate tool for exploring published literature. It does not determine county review priorities. Responses should be checked against the cited sources.
Example snapshot for Montgomery County, Virginia. Technical release id: governed-2026-10-15-january-climate-prod. Data-release methodology is semantic-2.0.0. Scoring methodology is surveillance-gap-score-v1.1, Smooth k=50. Applying the approved scorer to these cited inputs gives 30.4, in the Watch band. The county record was loaded on 15 October 2026, and the source findings were checked on 17 October 2026. The score was reconciled against the approved shared scorer on 20 October 2026.
Virginia has 293 state-unallocated 2023 records. They cannot be assigned to Montgomery County, and they are not part of the county count of 71.
Explore county-level Lyme disease data, review the findings in context, and consider questions for local follow-up. One Health Atlas brings the sources together to support informed public health review.